A Deeper Look at Entrepreneurship Efficiency in the United States

Written by Roberto Gallardo and Indraneel Kumar.
In our previous post, we introduced a new entrepreneurship metric—entrepreneurship efficiency or EE—that takes into consideration not only the share of entrepreneurs from workers but also the share of workers from total population age 16 and over. This metric was inspired by the location-quotient metric used in industrial or occupation analyses and had a stronger relationship with GDP compared to other traditional entrepreneur metrics.
Now, we look at state and county EE between 2010 and 2018. Data was obtained from the American Community Survey and counties were grouped into urban, mostly urban, mostly rural, and rural based on the rurality matters criteria from the U.S. Census. Urban counties had less than one percent of their population living in rural areas; mostly urban counties had between one and 49.9% living in rural areas; mostly rural had between 50 and 98.9% of their population living in rural areas; and rural counties where 99% or more of their population lived in rural areas.
Figure below displays one of the “traditional” entrepreneurship metrics: share of nonfarm proprietors of total employed (NFP) between 2010 and 2018. Results indicate this metric increased in the U.S. and across all county types during this period. Rural counties had a higher share compared to the other county types. However, as discussed previously, this metric does not factor in the worker/population pool from which these workers and entrepreneurs draw from. For that, we look at the EE metric next.
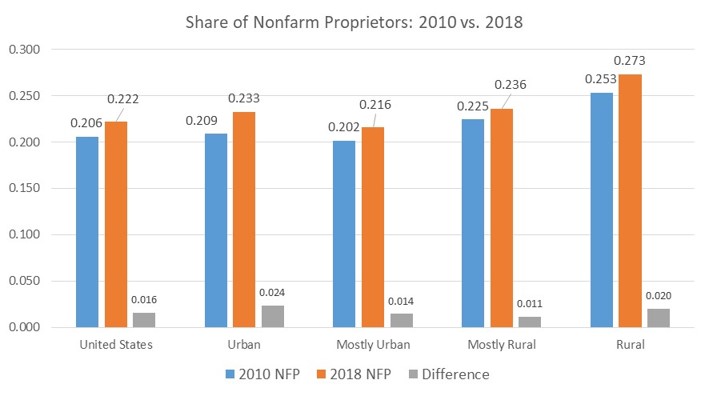
Source: PCRD; Bureau of Economic Analysis
In contrast to the nonfarm proprietor entrepreneurship metric, the figure below shows that the EE metric declined in the U.S. and across all county types during the same time period. This supports other research that have found business startups are declining. Note though that rural counties also had a higher EE compared to the other county types.
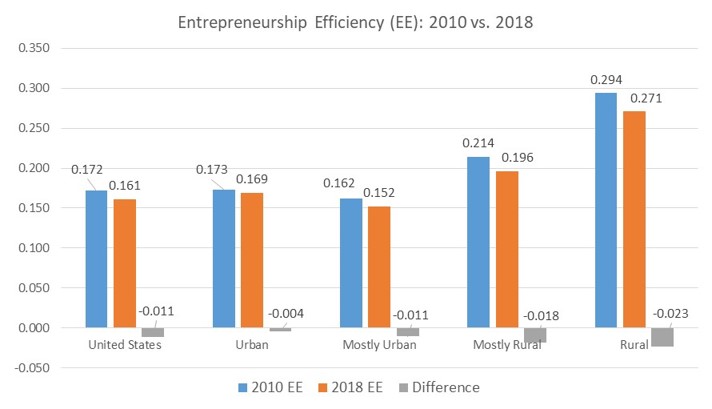
Source: PCRD; American Community Survey
What the entrepreneur story says depends on the metric used. While the share of nonfarm proprietors tells a good story, the EE tells a less rosy story. Both stories agree that rural indeed has a higher entrepreneurial activity compared to urban. Keep in mind, however, that there are two main types of entrepreneurs: innovative or high-growth and common or reactionary. Innovative or high-growth typically bring a new product, service, or process and potentially become a major source of local employment. Common entrepreneurs take advantage of local market opportunities (e.g. grocery store) and do not exceed a certain size while reactionary entrepreneurs start a business because they cannot find employment. Common or reactionary tend to be more prevalent in rural counties and have higher survival rates.
Also, rural counties with a higher EE may have a higher share of self-employed farmers. Note the map below showing four equal groups (quartiles) of counties based on their 2018 EE metric. The group with the highest EE is dark blue. While the data does not allow us to distinguish between non-farmers self-employed and all other self-employed, a Pearson correlation (not shown) between the share of self-employed and the share of workers employed in multiple industries indicates that those employed in agriculture, construction, and working from home are strongly associated with self-employment.
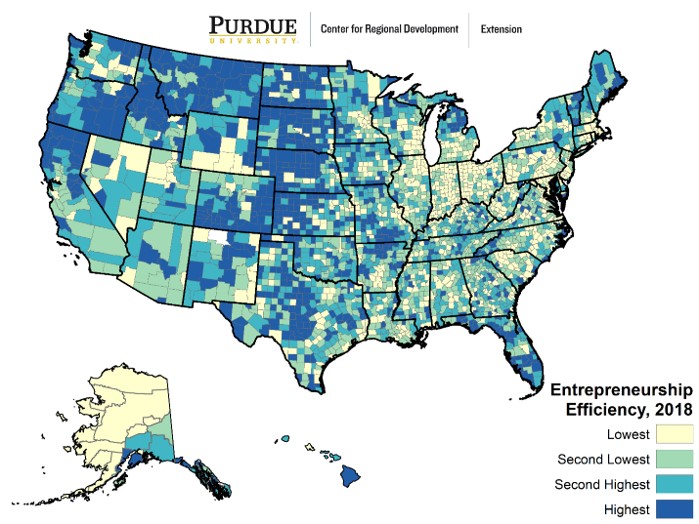
Source: PCRD; American Community Survey
The following two interactive tables (you can search for a particular state or sort any column in ascending/descending order) lists the EE and its component by state and counties between 2010 and 2018. In regards to states, note that the EE decreased in all but two (Delaware and Nevada) during this period. Montana had the highest EE (0.25) versus District of Columbia that had the lowest EE (0.11).
In regards to counties, more than two-thirds of counties experienced a decrease in their EE. The county with the lowest EE in 2018 was North Slope in Alaska (0.02) while Catron in New Mexico (1.06) had the highest. Note that all counties in the top 10 EE as of 2018 were rural counties (sort 2018 EE column in descending order and notice the type of counties listed).
What seems to explain the decrease in EE over time is a shrinking share of self-employed/workers. In the majority of states or counties where the share of workers/population increased, the share of self-employed/workers decreased enough to drag down their EE. In other words, even though the pool of potential entrepreneurs expanded, the share of actual entrepreneurs decreased at a higher rate.
A reason for this could be that the number of reactionary entrepreneurs has decreased significantly over this period due to low unemployment levels. Likewise, the EE may be affected by a decreasing number of self-employed farmers, which is strongly correlated with the share of self-employed along with construction and working from home. Unfortunately, the data does not allow us to parse out what type of entrepreneur is making the share of self-employed/workers decrease.
Nonetheless, hopefully this metric puts into a bit more perspective the entrepreneur potential available in your communities and help gauge how much of this potential is converted into entrepreneurs, regardless of type and industry.

Dr. Bo Beaulieu is Professor Emeritus of Rural and Regional Development, Purdue Center for Regional Development and the Department of Agricultural Economics. Bo has played a... read more